From R to AgentCubes
Here is where each piece of Wednesday’s R model lives in AgentCubes:
| In our R model | In AgentCubes |
|---|---|
The forest matrix |
The world: a grid you paint agents onto |
A cell’s value: TREE, BURNING, EMPTY |
An agent’s shape: healthy, burning, or dead |
Nested for loops over every cell |
Nothing to write: every agent runs its rules each tick |
if / else if |
A list of if–then rules, checked from top to bottom |
runif(1) < p |
The percent-chance condition |
Reading forest, writing new_forest |
Two methods, check and then act, called by a controller |
plot() after the run |
A plot window that updates while the fire burns |
The forest
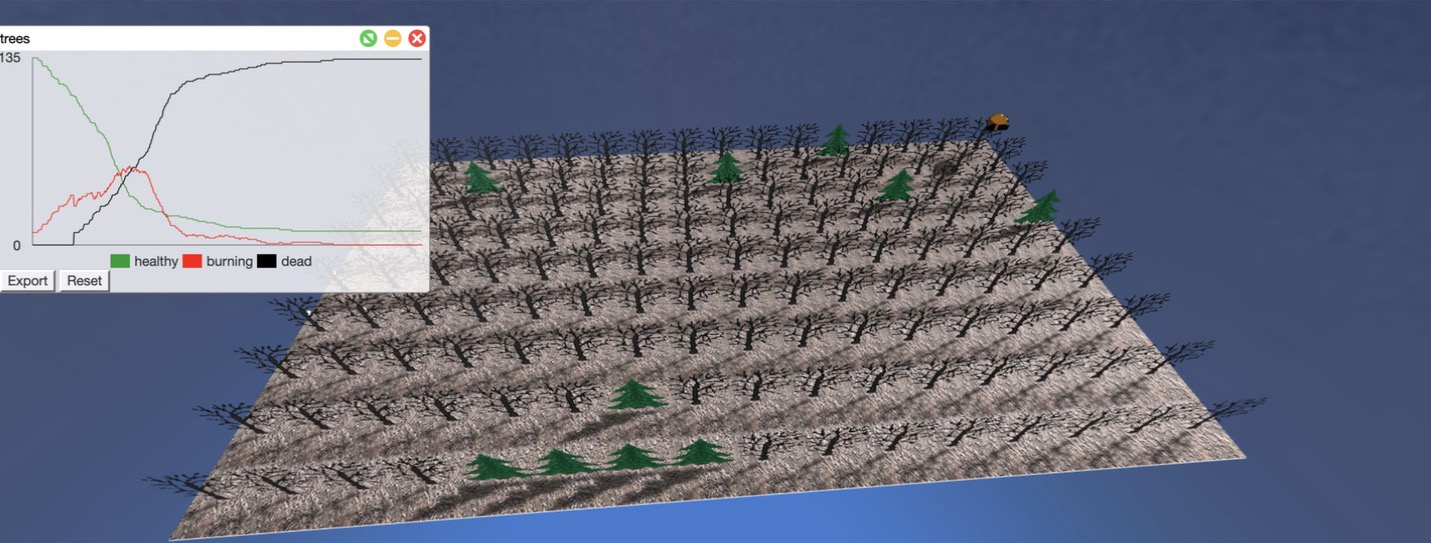
The world has a floor agent for the ground, a controller agent (the beaver in the corner) that runs the simulation, and a tree agent with three shapes:
- healthy: a green tree,
- burning: a tree on fire, and
- dead: a bare black trunk.
One difference from R: a burned tree doesn’t become empty ground. It stays on the grid as a dead tree, so it can’t catch fire again.
Each tree also has two attributes, which are numbers that belong to that one agent, like a variable each tree carries around:
igniteis 1 when the tree has been set to catch fire.clockcounts how many ticks the tree has been burning.
Check, then act
Remember why the R code read from forest and wrote into new_forest? If trees changed as we went, a tree that caught fire a moment ago could spread fire again in the same step.
AgentCubes has the same problem, and we solve it the same way, in two phases each tick:
- check: every tree looks at its neighbors and decides what will happen. Nobody changes shape yet.
- act: after all the trees have checked, every tree carries out its decision.
The controller
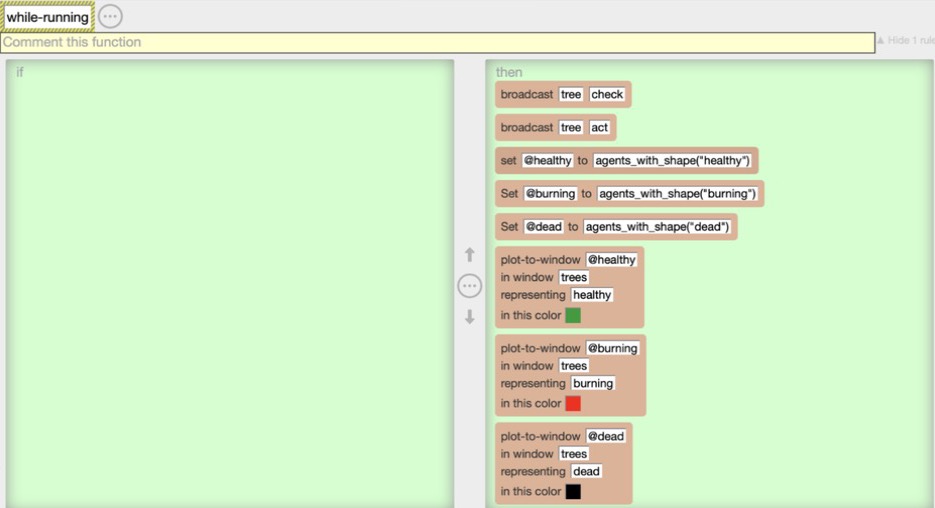
The controller’s while-running method runs once every tick. It broadcasts check to every tree, then broadcasts act, so all the checking finishes before any tree changes. Then it counts the trees of each shape with agents_with_shape() and adds those counts to the plot.
The check method
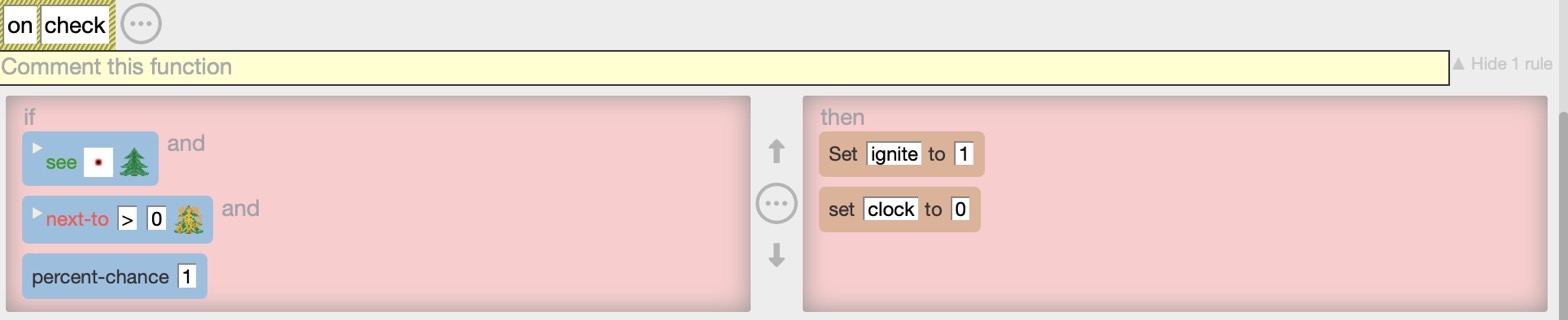
Read it as one sentence: if I’m a healthy tree, and at least one tree next to me is burning, and a small random chance comes up (1% in this picture), then set ignite to 1 and reset clock to 0.
The tree doesn’t catch fire here. It only makes a note in ignite.
The act method
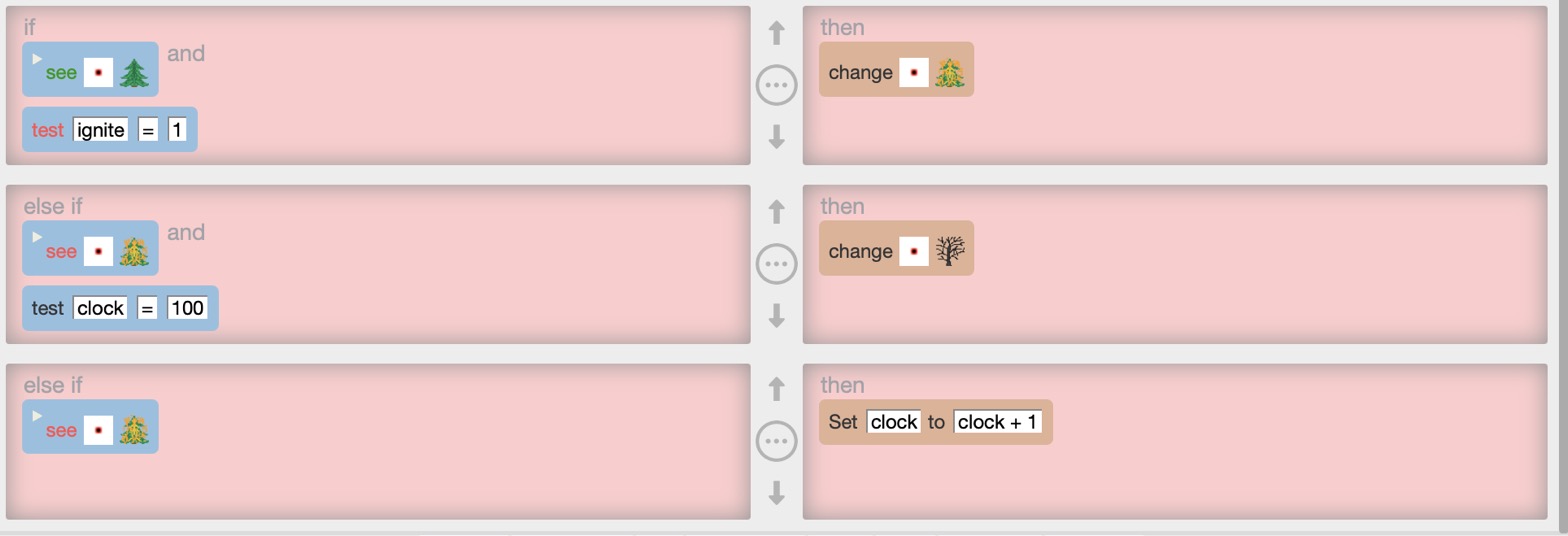
AgentCubes tries the rules from top to bottom and uses the first one that’s true, just like if / else if in R:
- A healthy tree with
ignite = 1changes to burning. - Otherwise, a burning tree whose
clockhas reached 100 changes to dead. - Otherwise, a burning tree adds 1 to its
clock.
So a burning tree burns for 100 ticks before it dies.
Build it
Follow along as we build it together:
- Make the agents. Create a tree agent with three shapes (healthy, burning, dead), a floor agent, and a controller agent.
- Paint the world. Cover it with floor, then fill it with healthy trees.
- Add the attributes. Give the tree
igniteandclock, both starting at 0. - Write
on check. Add one rule, as in the picture above. - Write
on act. Add the three rules, in this order. What would go wrong if theclock + 1rule came first? - Light a fire. Draw one burning tree in the middle of the forest.
- Write the controller. Broadcast
check, thenact, then plot the number of healthy, burning, and dead trees. - Run it. Watch the fire spread, and watch the plot as it runs.
How this model differs from ours in R
Look at the example world above. Every cell had a tree, but a few trees survived. In our R model, a forest that full would burn completely. Why the difference?
- Spreading takes luck. In R, a tree next to a fire always caught fire on the next step. Here, each tick, a tree next to a fire has only a small chance. But a neighbor burns for 100 ticks, so the tree gets 100 tries. At 1% per tick, the chance it never catches is \(0.99^{100}\), about 37%, so it catches fire about 63% of the time.
- Burning takes time. In R, a tree burned for one step. Here it burns for 100 ticks, and the
clockattribute keeps track. - Dead trees stay. A burned tree becomes a dead trunk instead of bare ground.
The rules are still local, and the pattern of the whole forest still emerges from them, just as on Wednesday.
Try it
Change one thing at a time, run it again, and compare the plot with the first run:
- Change the percent-chance to a smaller value, then to a larger one, such as 3. How much of the forest burns each time? How does the shape of the red curve change?
- Change the
100inclock = 100to20, so trees burn out faster. Why might fewer trees burn? - Erase some trees to make the forest less dense, as we did in R with
prob_tree. Can you find a density where the fire usually dies out?