days <- 250   # about one year of trading days
x <- 1:days
y1 <- numeric(days)
y2 <- numeric(days)
y3 <- numeric(days)
y1[1] <- 10
y2[1] <- 10
y3[1] <- 10

for (i in 2:days) {
  y1[i] <- y1[i - 1] + runif(1, -0.2, 0.2)
  y2[i] <- y2[i - 1] + runif(1, -0.2, 0.2)
  y3[i] <- y3[i - 1] + runif(1, -0.2, 0.2)

  plot(x[1:i], y1[1:i], type = "l", col = "red",
       xlim = c(1, days), ylim = c(4, 16),
       xlab = "Trading day", ylab = "Price ($)")
  lines(x[1:i], y2[1:i], col = "blue")
  lines(x[1:i], y3[1:i], col = "darkgreen")

  Sys.sleep(0.05)
}
A toy stock market
Here is our whole model of a stock: each trading day, the price moves by a random amount between 20 cents down and 20 cents up.
runif(1, -0.2, 0.2) picks that amount. In Module 9.5, each step was a coin flip with two possible results. Here, any amount in the range can happen, but the idea is the same: new position = old position + random step.
This isn’t how real stocks behave. Real prices move by percentages, jump on news, and depend on what other people do. It’s a random walk wearing a stock market costume, and that’s enough to teach us something.
Watch three companies
Start three companies at $10, with exactly the same rule. This code draws the graph inside the loop, so it redraws every day and the lines grow as you watch. Sys.sleep() pauses briefly between days. Run it in Positron, then run it again.
A web page can’t animate, so here is how one year turned out, with the graph drawn once at the end:
set.seed(10)
days <- 250
x <- 1:days
y1 <- numeric(days)
y2 <- numeric(days)
y3 <- numeric(days)
y1[1] <- 10
y2[1] <- 10
y3[1] <- 10

for (i in 2:days) {
  y1[i] <- y1[i - 1] + runif(1, -0.2, 0.2)
  y2[i] <- y2[i - 1] + runif(1, -0.2, 0.2)
  y3[i] <- y3[i - 1] + runif(1, -0.2, 0.2)
}

plot(x, y1, type = "l", col = "red", ylim = c(4, 16),
     xlab = "Trading day", ylab = "Price ($)",
     main = "Three companies, one rule")
lines(x, y2, col = "blue")
lines(x, y3, col = "darkgreen")
abline(h = 10, lty = 3, col = "gray50")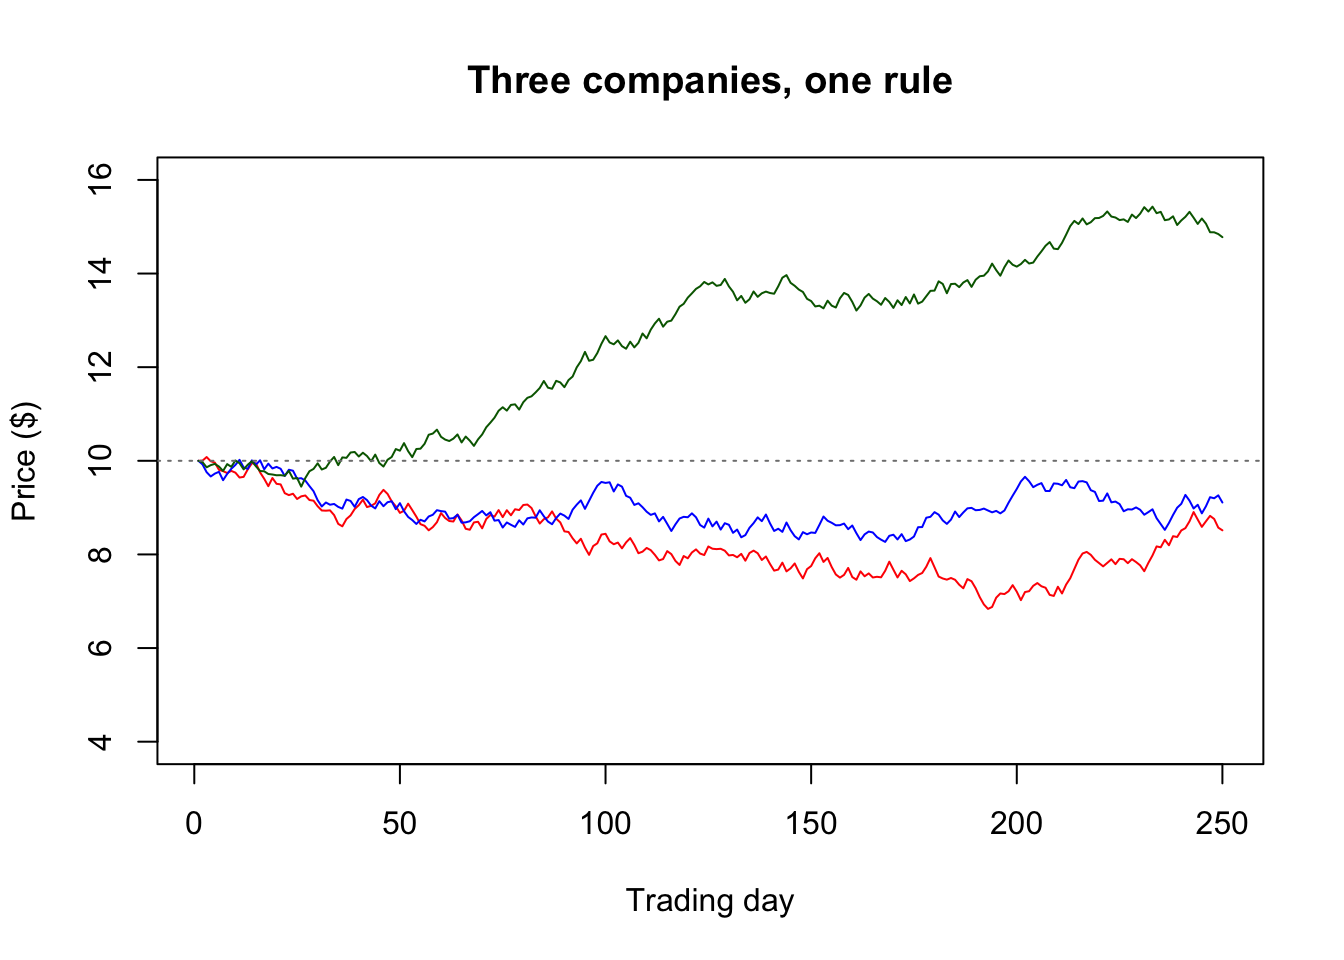
Which company would you say is the best run? If you read a news story about the winner, what would it say? Nothing is different about these companies. The rule is identical, and the winner just got the luckier draws. Random walks make patterns that look like trends and stories.
Add a rule for selling
Now hold one share, and add our rule: sell at $13 or at $8. This is the same setup as Project 4, in different clothes:
| Lost hiker | Toy stock |
|---|---|
Position y, starting at 0 |
Price, starting at $10 |
| The road, 20 steps north | The target, $3 above the start |
| The river, 10 steps south | The stop, $2 below the start |
| 240 minutes of daylight | 250 trading days |
Ending: "road", "river", or "lost" |
Ending: "target", "stop", or "holding" |
Before running anything: what’s the fewest number of days it could take to reach the target? The stop?
Once the price reaches either line, the simulation should stop. break leaves a loop immediately, and after a break, i still holds the pass the loop stopped on. That’s how we know how many days we held the share.
set.seed(15)
target <- 13
stop_price <- 8
days <- 250

price <- numeric(days + 1)
price[1] <- 10
outcome <- "holding"

for (i in 2:(days + 1)) {
  price[i] <- price[i - 1] + runif(1, -0.2, 0.2)
  if (price[i] >= target) {
    outcome <- "target"
    break
  }
  if (price[i] <= stop_price) {
    outcome <- "stop"
    break
  }
}

days_held <- i - 1
outcome
[1] "target"days_held[1] 85The vector has room for every day, but only the entries up to i were used, so plot 1:i:
plot(1:i, price[1:i], type = "l", ylim = c(7, 14),
     xlab = "Day (1 is the day we bought)", ylab = "Price ($)",
     main = "One share with a sell rule")
abline(h = target, col = "darkgreen", lwd = 2)
abline(h = stop_price, col = "red", lwd = 2)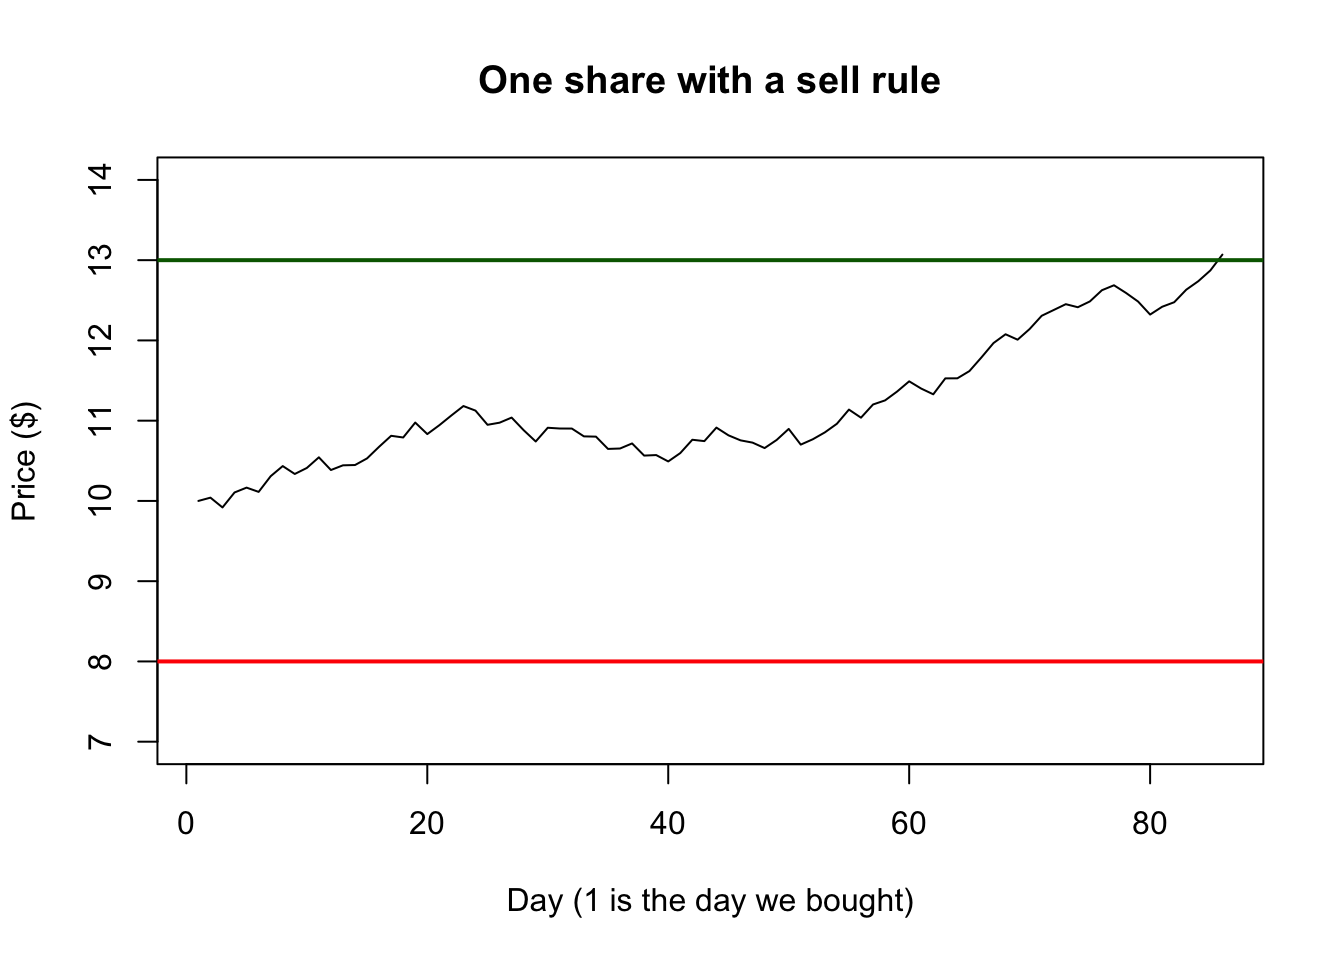
Change the seed and run it a few times. One run is one story. It can’t tell us the chance of hitting the target, just as one hike can’t tell you the chance of reaching the road.
If we have time: a tiny edge
Suppose the company is very slightly better than a fair walk. Change the top of the range from 20 cents to 21 cents, so the price drifts up by an average of half a cent a day:
set.seed(2)
outcome <- character(shares)

for (share in 1:shares) {
  price <- 10
  outcome[share] <- "holding"
  for (day in 1:days) {
    price <- price + runif(1, -0.2, 0.21)
    if (price >= target) {
      outcome[share] <- "target"
      break
    }
    if (price <= stop_price) {
      outcome[share] <- "stop"
      break
    }
  }
}

c(target = mean(outcome == "target"),
  stop = mean(outcome == "stop"),
  holding = mean(outcome == "holding"))
target stop holding
0.277 0.105 0.618 Would you notice half a cent on any one day? Probably not, but look at what it does over a year. Small differences in a rule can add up to large differences in the result.