Suppose a recovering population grows toward a carrying capacity. When will it first reach 500? Will Euler, RK2, and RK4 give the same answer if we take one-year steps?
NoteReading and code
This is practice with textbook Modules 6.2–6.4, not a new book module. Download the complete R script after coding along. Project 3 asks for Euler and RK2 on a different model; RK4 is not required there.
Return to constrained growth
We will reuse the logistic model from Module 2.3, but pay attention to the numerical method rather than inventing a new model:
\[
\frac{dP}{dt}=rP\left(1-\frac{P}{K}\right).
\]
Start with \(P(0)=100\), growth fraction \(r=0.8\) per year, and carrying capacity \(K=1000\). Simulate through year 8. Each method must use these same assumptions; only the update rule will change. We will use a one-year time step first.
Before coding, predict: will the three methods give the same year for reaching 500? How might a large time step affect that answer?
One old population, three ways to step
At the start, the rate is \(0.8(100)(1-100/1000)=72\) population units per year. With \(\Delta t=1\) year:
Euler: use that starting rate for the whole step, giving \(100+72=172\).
RK2: use Euler’s trial value of 172 to get a second rate, then average the starting and trial-end rates. What value do you expect—below or above 172?
RK4: take four trial rates from the same starting value and combine them with weights \(1,2,2,1\). None of its trial values becomes the stored population until the final update.
The population increases faster as it moves away from 100, so Euler’s first step should be the lowest of the three. But that observation does not prove the methods will preserve the same ordering forever; the rate slows again as \(P\) approaches \(K\).
Code all three methods side by side
Keep a separate population vector for each method. At every iteration, read that method’s old value before calculating its trial rates. We do not need to put the simulation inside a function.
start_time <-0end_time <-8delta_t <-1# years per steptime <-seq(start_time, end_time, by = delta_t)initial_population <-100growth_fraction <-0.8# per yearcapacity <-1000target <-500euler <-numeric(length(time))rk2 <-numeric(length(time))rk4 <-numeric(length(time))euler[1] <- initial_populationrk2[1] <- initial_populationrk4[1] <- initial_populationfor (i in2:length(time)) {# Euler: one rate at the old population. old_euler <- euler[i -1] euler_rate <- growth_fraction * old_euler * (1- old_euler / capacity) euler[i] <- old_euler + euler_rate * delta_t# RK2: predict an endpoint, then average the old and trial-end rates. old_rk2 <- rk2[i -1] rate_1 <- growth_fraction * old_rk2 * (1- old_rk2 / capacity) predicted <- old_rk2 + rate_1 * delta_t rate_2 <- growth_fraction * predicted * (1- predicted / capacity) rk2[i] <- old_rk2 + (rate_1 + rate_2) /2* delta_t# RK4: four full-step trial changes, all built from the old value. old_rk4 <- rk4[i -1] change_1 <- growth_fraction * old_rk4 * (1- old_rk4 / capacity) * delta_t trial_mid_1 <- old_rk4 + change_1 /2 change_2 <- growth_fraction * trial_mid_1 * (1- trial_mid_1 / capacity) * delta_t trial_mid_2 <- old_rk4 + change_2 /2 change_3 <- growth_fraction * trial_mid_2 * (1- trial_mid_2 / capacity) * delta_t trial_end <- old_rk4 + change_3 change_4 <- growth_fraction * trial_end * (1- trial_end / capacity) * delta_t rk4[i] <- old_rk4 + (change_1 +2* change_2 +2* change_3 + change_4) /6}results <-data.frame(time, euler, rk2, rk4)round(results[1:4, ], 3)
The first row is the initial population. The next row should be approximately 172.000 (Euler), 192.966 (RK2), and 198.131 (RK4). If your values differ, inspect the first step before looking at the whole eight-year simulation. In particular, all four RK4 trial changes must begin from old_rk4.
Ask the decision question
Find the first recorded time at which each method reaches or exceeds 500. A position in an R vector is not a year, so look up the corresponding value of time.
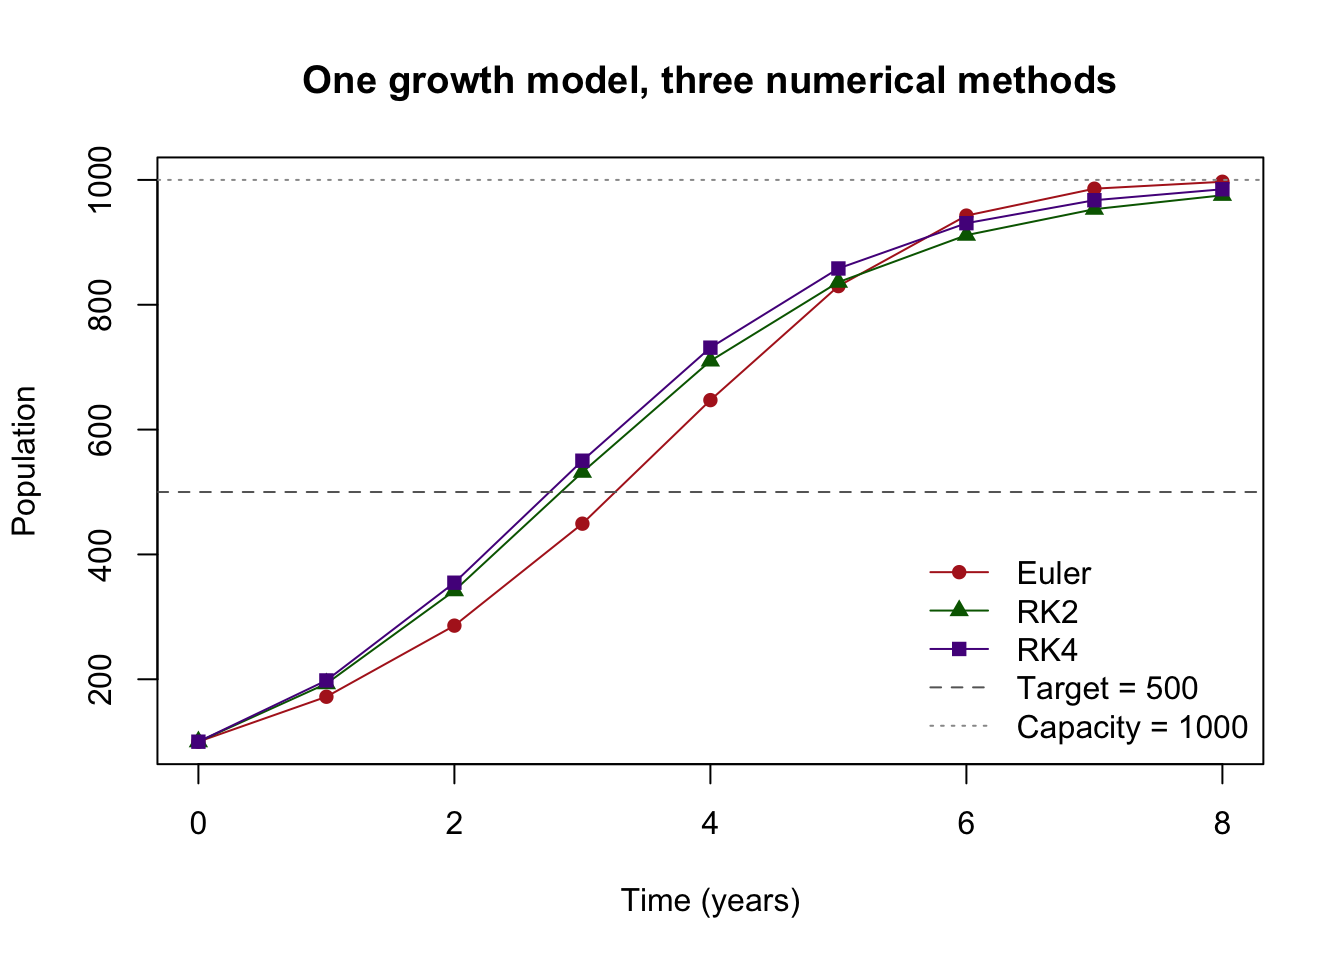
With one-year steps, Euler first records 500 or more at year 4, while RK2 and RK4 do so at year 3. This is a difference in the recorded threshold year; none of these values tells us the exact instant the population crosses 500 between observations. What would you tell someone who needs to plan for that milestone?
See the entire trajectory
plot(time, euler, type ="o", pch =16, col ="firebrick",ylim =range(c(euler, rk2, rk4, capacity)),xlab ="Time (years)", ylab ="Population",main ="One growth model, three numerical methods")lines(time, rk2, type ="o", pch =17, col ="darkgreen")lines(time, rk4, type ="o", pch =15, col ="purple4")abline(h = target, lty =2, col ="gray40")abline(h = capacity, lty =3, col ="gray60")legend("bottomright", c("Euler", "RK2", "RK4", "Target = 500", "Capacity = 1000"),col =c("firebrick", "darkgreen", "purple4", "gray40", "gray60"),lty =c(1, 1, 1, 2, 3), pch =c(16, 17, 15, NA, NA), bty ="n")
Do not just identify the smoothest line. Which method first reaches the target on our yearly grid? Do the methods move closer together later? What does the carrying-capacity line mean for the model?
Change the time step, not the model
Change only delta_t to 0.5 year, rerun the simulation and decision chunks, and record the three first times. Then try 2 years. Keep the same initial population, growth fraction, capacity, target, and eight-year endpoint.
\(\Delta t\) (years)
Euler first reaches 500
RK2 first reaches 500
RK4 first reaches 500
2
year 4
year 4
year 4
1
year 4
year 3
year 3
0.5
year 3.5
year 3
year 3
Why can the two-year grid make all three methods report year 4 even though their predicted populations differ? At \(\Delta t=2\), Euler even predicts a population above the carrying capacity by year 8. Is that a feature of the logistic model, or a warning about the numerical step?
ImportantKeep the two kinds of uncertainty separate
Smaller steps and a higher-order method can reduce numerical error for this equation. They cannot tell us whether \(r=0.8\), \(K=1000\), or even the logistic model is a good description of the real population. A precise solution to a poor model can still be a poor prediction.
If we have time: check against the exact model
For this particular logistic equation, the exact mathematical solution is
\[
P(t)=\frac{K}{1+(K/P_0-1)e^{-rt}}.
\]
We do not need to derive it. Use it to check the methods at year 8, then say whether a tiny numerical error would change your confidence in the real-world forecast.
If you changed the time step above, restore delta_t <- 1 and rerun the simulation to compare the original one-year results. At that step, the exact model predicts about 985.27 at year 8. Notice that RK4’s year-8 estimate is close to that value, but accuracy relative to the equation is not validation of the equation itself.